Five metals · 50+ currencies · 15 years
The metals market, explained while you watch it.
Aurix tracks gold, silver, platinum, palladium and copper in any currency you like — then Aura tells you what the move actually means. Free on iPhone, iPad and Android.
Inside the app
Six screens do most of the work
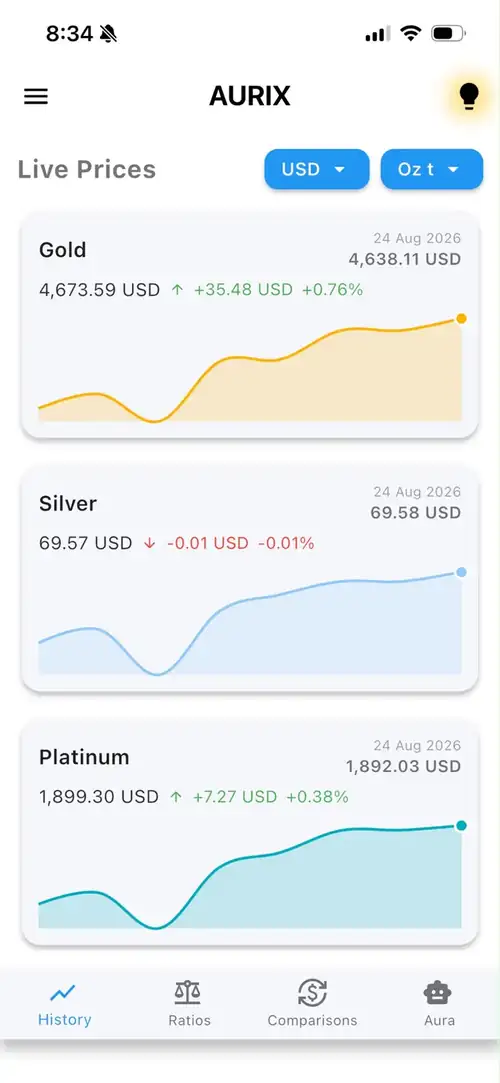
Everything else in Aurix hangs off these. Pick one to see the real screen.
Real screenshots straight from the app, taken today. Where both exist, they follow this page's light or dark setting.
Aura Smart Hub · Premium
The part that answers back
Aura reads the same fifteen years of prices the charts do. Ask it something — these are questions people actually ask it.
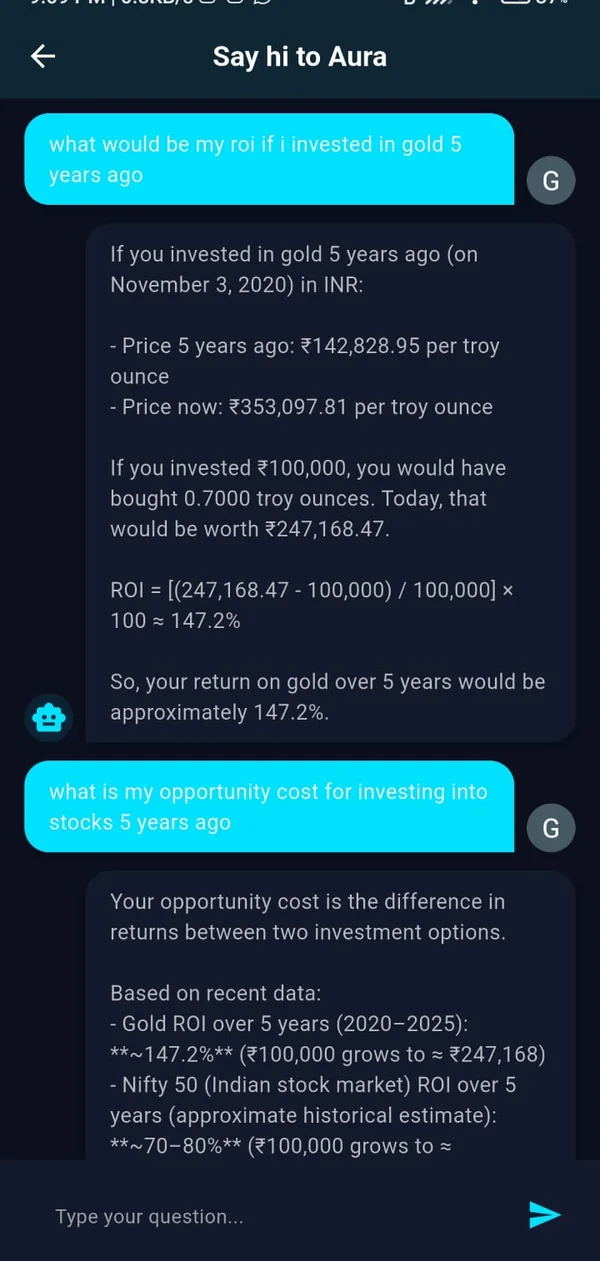
Answers shown here are illustrative. Aura is educational and never gives investment advice.
The rest of it
Nine modules shipped. Three on the roadmap.
Everything below is in the build you can download today, except the last card. Roadmap items are labelled as roadmap — nothing here is coming-soon dressed up as a feature.
Live spot prices
Gold, silver, platinum, palladium and copper with the change since the previous close, in any of 50+ currencies.
History tab
Fifteen years on every metal — 1M, 6M, 1Y, 5Y, 15Y presets plus a custom date range, with the high, low and change for whatever window you pick.
Ratios tab
Gold/Silver, Gold/Platinum, Gold/Palladium, Platinum/Palladium and Gold/Copper, each with its own history chart and daily change.
Currency converter
Any currency against any other, live, with a historical chart of the pair — so you can see what your own currency did while the metal moved.
Top assets
The world's largest assets by market capitalisation, ranked — metals sitting in the same list as NVIDIA, Apple, Aramco and the rest.
Insight of the day
One short card of market context daily. Tap the bulb to replay it any time.
Comparisons tab
Put a metal next to anything — another metal, a currency, a crypto asset or a stock index — over the same window, indexed so the lines are actually comparable.
Aura Smart Hub
Ask questions of the app's own price history in plain language. Voice input, saved chat history, and any answer can be shared out.
AI forecasting
A forecast overlay from six months to two years, drawn as a scenario with the disclaimer on the chart, not buried in a footer.
News summariser
A sixty-second daily briefing on what actually moved the metals, in the same plain language as the guides.
Notify me when it ships
One email. No newsletter, no sharing your address.
Education hub
The guides from this site, inside the app, next to the chart they are explaining.
Notify me when it ships
One email. No newsletter, no sharing your address.
Correlation matrix
A cross-asset view of how the five metals move with each other, with currencies and the wider market.
Notify me when it ships
One email. No newsletter, no sharing your address.
Try the thinking
Three things the app does that nothing else on your phone does
Metal ratios, and where they sit
A ratio on its own is a number. What tells you something is where that number sits against its own history — which is what the app shows and almost nothing else does.
At 66.66, roughly 41% of the way through its twenty-year range. Above 80 silver has historically looked cheap against gold; below 50 the reverse. Right now it is neither.
Live values from the app, 24 Aug 2026. Range bounds are rounded twenty-year extremes. What the ratio actually tells you →
Any metal, any weight, any currency
The unit people actually buy in — grams, tolas, kilos — priced in the currency they actually hold, with the year's move alongside.
Illustrative rates — live cross-rates and the full pair history are in the app.
The global price of gold is quoted in U.S. dollars, so changes in currency exchange rates can affect returns for investors outside the U.S.
One card a day, written to be read in fifteen seconds — then handed to Aura if you want to go deeper.
Get the daily cardTop assets
Where gold and silver actually sit
Gold is the world's largest asset — worth more than the nine biggest companies on earth combined. Silver, on an honest basis, is smaller than Saudi Aramco.
Most people have never seen either one put next to the companies they read about every day. The app ranks both metals against every other major asset and updates as markets move — and the gap between them is the point.
| # | Asset | Value | Type | Basis |
|---|
Company values are last close, 20–21 Aug 2026. Gold and silver are estimates — a stock figure multiplied by a spot price, so they carry the date of both. Gold uses 220,700 t of above-ground stock (World Gold Council, end-2025). Silver uses 19.3 bn oz of surviving above-ground stock (Silver Institute, end-2023), not the 56 bn oz ever mined, most of which was industrially consumed and is unrecoverable — a distinction that moves silver from roughly $3.9T to $1.3T, and from fifth place to fourteenth.
Shorter horizons, and a number you can check us on
Premium looks 6 to 24 months out. Aurix Elite looks 7 days to 3 months — and instead of drawing a line, it gives you a range and a probability.
Gold, silver, platinum, palladium and copper, in your own currency.
A range, not a line
Nobody knows where gold closes on a Tuesday. What can be estimated is how far it can plausibly travel between now and then — a band that gets wider when the market is moving and narrower when it isn't.
“Will I get my price?”
The question people actually have isn't where the price will be, it's whether it will come to the number they had in mind. Elite answers that one directly: the chance of gold reaching your number at some point inside the window.
How much it's moving right now
Gold's typical weekly swing is not a constant. Elite shows you the current one against its own normal, so you know whether this is an ordinary week or an unusual one.
We'll publish how often we were right. Including when we weren't.
Every forecast Elite makes is recorded before you see it. When the window closes we score it, and the result goes on a page anyone can read: how often the range actually held, against the number we said it would, with the margin of error shown.
As far as we can tell, nobody else in this category publishes that. It's the reason we're building Elite the way we are, and it's the part we'd rather be judged on.
It won't tell you what to do with your money, it won't quote a level to act on, and it won't claim to be right a certain share of the time. It's a range and a probability, and like everything else in Aurix it's educational only.
Tell us if you want this
We're building it in the order people ask for it.
One email. No newsletter, no sharing your address.
Guides
Metals, explained without the sales pitch
The context a price chart assumes you already have. No position taken, nothing sold. And in the Academy, eight free lessons on the other side of it — hallmarks, purity testing, and what a piece of jewellery actually costs per gram of gold.
The gold–silver ratio, explained
The oldest indicator in metals — what it measures, and what it can't tell you.
Read → PricingWhat "spot price" really means
Why the number on your screen isn't the price you pay at a dealer.
Read → FundamentalsThe five metals and what moves them
Gold, silver, platinum, palladium and copper have almost nothing in common.
Read →The same data, as an API
Spot prices, fifteen years of daily history, ratios and currency conversion for five metals — the feed the app reads, opened up for people building their own things. Early access sign-up is open.
Download
Free on iPhone, iPad and Android
Education category, 4+, no account required to look around.
Scan to install on iPhone
Point your camera at the code — it opens the Aurix listing on the App Store.